PUE, WUE, CUE: Decoding the Alphabet of Data Center Efficiency
Every data center brags about its PUE, but the industry average hasn't budged in six years. Here's how the big efficiency metrics actually work, how they get gamed, and what to look for in a company's claims.
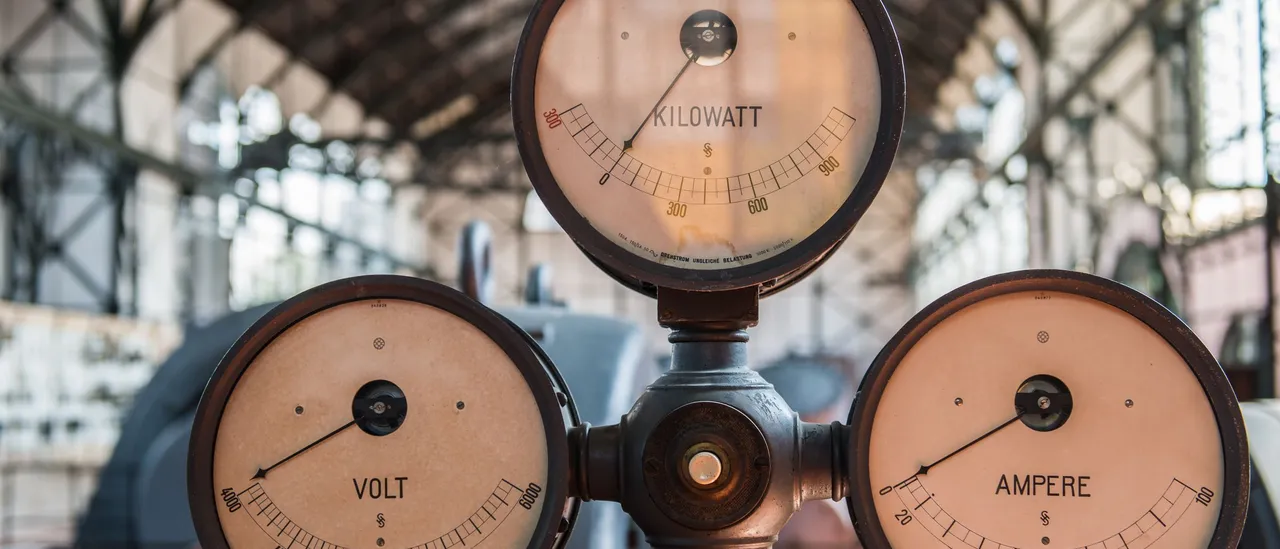
Ask a data center operator how green their facility is and you will get a number: “We run a PUE of 1.2.” It sounds precise, scientific, settled. It is also one of the most creatively marketed numbers in the industry. Here is what the efficiency alphabet actually says, and what it carefully does not.
PUE, the number everyone quotes
Power Usage Effectiveness, standardized by the industry consortium The Green Grid, is a simple ratio: total facility energy divided by the energy that reaches the IT equipment itself. Everything else (chillers, fans, pumps, power conversion losses, lighting) is overhead, and PUE tells you how much of it you’re carrying.
A worked example. Say a facility draws 10 megawatts from the grid over a year, and its servers and network gear consume 6.5 of those megawatts. Divide 10 by 6.5 and you get a PUE of about 1.54: for every watt of computing, the building burns roughly half a watt more on cooling and power delivery. A perfect score is 1.0, which is physically unreachable, since power conversion and heat removal always cost something. A PUE of 1.2 means overhead is about 17 percent of the total bill.
That example wasn’t random. According to the Uptime Institute’s 2025 Global Data Center Survey of more than 800 operators, the industry’s average annual PUE is 1.54, essentially unchanged for six consecutive years. Uptime attributes the stall to aging legacy facilities, hot climates, and the fact that the cheap fixes (hot-aisle containment, better airflow) were harvested a decade ago.
The industry average PUE has been stuck around 1.54 for six straight years, according to the Uptime Institute. Google reports a fleet-wide 1.09.
Meanwhile Google reports a trailing twelve-month PUE of 1.09 across its fleet, a figure it says includes all overhead sources in all seasons. Purpose-built hyperscale campuses running custom hardware at high utilization really are that much leaner. The gap between 1.09 and 1.54 is the gap between the industry’s showcase and its long tail.

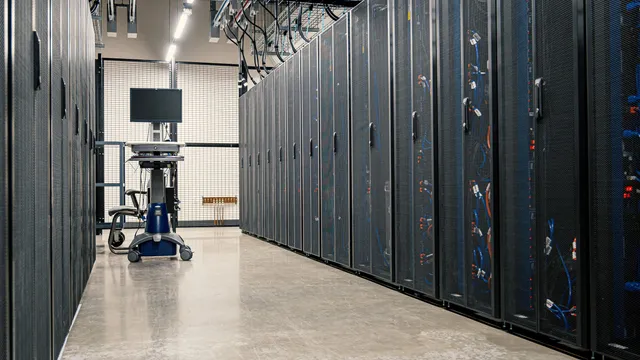
Photo: Brett Sayles / Pexels
How the number gets gamed
PUE was designed to track one facility’s progress over time, not to rank competitors, and The Green Grid has said so repeatedly. That has not stopped the marketing arms race. A few classic moves to watch for, documented in a joint Lawrence Berkeley National Laboratory and Green Grid examination of the metric:
Design versus measured. A “design PUE” of 1.15 is a simulation of a full, ideally loaded building. A half-empty hall on a July afternoon behaves very differently. Annualized, measured numbers are the only ones that count.
Snapshot seasons. A PUE captured on a cool spring night flatters any facility. Reputable operators report twelve-month averages; Google’s published 1.09 is a trailing annual figure for exactly this reason.
Boundary games. Measuring IT load at the UPS output rather than at the rack quietly shifts distribution losses into the “IT” column and improves the score, according to the LBNL examination.
And there is a deeper blind spot: PUE says nothing about whether the computing itself is useful. A hall full of idle, obsolete servers can post a gorgeous PUE. The metric also gets strange with liquid cooling, now sweeping AI facilities. When cooling moves inside the server (cold plates, pumps, and coolant loops powered through the rack), that energy counts as IT load, so PUE can hold flat or even worsen while real consumption drops. Cooling vendor Vertiv notes that a site can cut total power meaningfully while its PUE barely moves, which is why analysts argue liquid-cooled AI campuses need supplementary metrics.
Water, carbon, and the rest of the alphabet
WUE, or Water Usage Effectiveness, is The Green Grid’s 2011 companion metric: liters of water consumed per kilowatt-hour of IT energy. Estimates of a typical figure diverge; industry surveys cited by Data Center Knowledge and the Environmental and Energy Study Institute put common values anywhere from about 0.2 to 1.9 liters per kWh depending on climate and cooling design, with widely quoted averages near the top of that range. Google’s own accounting works out to roughly 1 liter per kWh fleet-wide, according to a 2025 Google research paper, while Microsoft reported about 0.30 liters per kWh and says its newest closed-loop designs consume zero water for cooling. Low WUE can hide a trade-off: dry cooling saves water but burns more electricity, nudging PUE up.
Photo: Marcin Jozwiak / Pexels
CUE, Carbon Usage Effectiveness, introduced by The Green Grid in 2010 and now formalized as ISO/IEC 30134-8, measures greenhouse gas emissions per unit of IT energy. Two identical buildings can have identical PUEs and wildly different CUEs, depending on whether the grid behind them runs on hydropower or lignite.
| Metric | What it measures | Perfect score |
|---|---|---|
| PUE | Facility energy vs. IT energy | 1.0 |
| WUE | Liters of water per IT kWh | 0.0 |
| CUE | Kg of CO2e per IT kWh | 0.0 |
| ERF | Share of energy reused (heat export) | Higher is better |
Europe stops asking nicely
Until recently, all of this was voluntary. The EU’s recast Energy Efficiency Directive changed that: under Delegated Regulation 2024/1364, data centers with at least 500 kilowatts of installed IT power demand must report annually to a new European database, with filings due each May 15 after an initial September 2024 deadline, according to coverage by Data Center Dynamics and legal analysis from CMS. Operators must submit roughly two dozen data points, including PUE, WUE, renewable energy factor, and energy reuse factor (how much waste heat gets a second life warming homes or greenhouses). Aggregated results will be published, and a mandatory sustainability rating scheme is in draft. For the first time, the metrics have regulatory teeth.
Reading efficiency claims like a pro
So when a company touts its efficiency, a curious reader should ask five questions. Is the PUE measured or designed? Is it a twelve-month average or a cherry-picked snapshot? Is it fleet-wide or the single best site? Does the company publish WUE and carbon intensity too, or only the flattering metric? And is the facility liquid-cooled, in which case PUE alone undersells or oversells the story?
The alphabet is genuinely useful. PUE drove a decade of real progress, from averages around 2.5 in 2007 to 1.54 today, per Uptime’s long-running surveys. Just remember what each letter measures, and, more importantly, what it politely declines to mention.
More in Explainers
All Explainers →
Who Gets to Plug In: FERC's Rewrite of the Rules for Connecting Data Centers to the Grid
A power plant has had a federal interconnection process for two decades. A gigawatt data center never did. In 2026 FERC ordered all six regional grid operators to invent one, and their answers, from MISO's non-firm service to PJM's curtail-first rule, will decide which campuses get power in 2027.
The Life and Death of a Server
Servers used to be written off after three years. Now hyperscalers stretch them to six while AI chips age out in two. What actually happens when a machine leaves the rack, and where millions of tonnes of hardware go next.
What's Actually Inside a Data Center: A Guided Tour
Server halls, diesel farms, mantraps, and rooms where the internet physically connects to itself: a plain-English walk through the buildings behind the cloud.